

Running a project successfully is akin to arranging Jenga blocks into a tower. Each block balances the tower, and a slight miscalculation—or even a sudden movement—can cause the block tower to crash entirely. Similarly, planning out each interdependent task on a project meticulously, quite like carefully moving blocks in a Jenga tower, is the key to achieving your project goals.
But there's good news. The Gantt chart is the champion of detailing dependencies of huge projects! And that too as a visual picture of the project schedule, across a horizontal timeline. Ace project organizing with this awesome tool on Sketchnote. Let's get started by understanding the Gantt chart and its components!
What is a Gantt chart?
A Gantt chart allows users to visualize all scheduled project tasks on their chosen timeline. Here, you can easily schedule, assign, and track projects from start to end. This chart significantly helps organize interdependent tasks, so that no time is wasted waiting on a dependency to be fulfilled.
Let's try to understand this with a real-life example. Say, your team wants to add a feature to your SaaS. They’ll usually begin by listing out all of the tasks necessary to complete the project on the Gantt chart. By scheduling all the tasks for the entire assignment, task cards will appear as bars on the chart, where each interdependent task can be viewed and tracked on the timeline. Each task, like designing the user interface, writing code, testing, and deploying, can be color-coded on the chart, to differentiate their categories. This leaves little to no room for any timeline-related ambiguity or miscommunication.
Get started with Gantt charts on Sketchnote
The good news: you can easily draw up your Gantt chart and get started on Sketchnote, in your quest to create the perfect project plan! Here's a quick walkthrough of how to start a fresh Gantt chart file. It's quite simple; really!
- Once you've signed up for Sketchnote head to the workstation dashboard.
- Click the “Start new file” button on the Sketchnote sidebar
- Choose “Gantt” under Task Views, and you're all set!
Now all you need to do is fill in your tasks and schedule them as and when they turn up. Once you do, your entire team can reckon with this chart when they need to. But before that, let's go through the components of the Gantt chart on Sketchnote. These make them so rewarding to use!
They are:
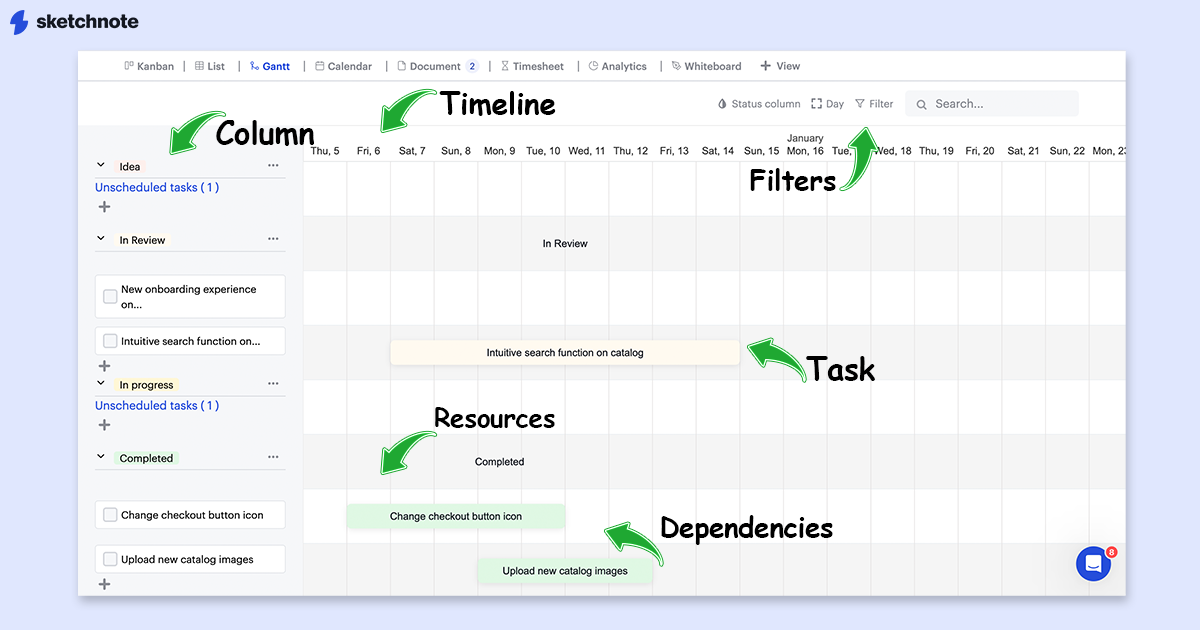
- Tasks: Each activity or task on the chart is represented as a horizontal bar on the chart. The length of the bar represents the duration of the task, across the Timeline
- Timeline: The chart illustrates the time frame for the entire project, usually displayed horizontally. Sketchnote allows for elaborate planning and has options to display the time axis on a scale of quarter days, half days, and days, weeks, and months.
- Columns: The stages of the tasks are depicted in the left-hand column. These are named Backlog, In progress, and Completed by default. Customize these titles based on your business processes and stages of completion specific to your business.
- Dependencies: The interrelationships between tasks of your project are depicted on the Gantt chart. This is visualized as a taskbar, one ending where another begins.
- Resources: The people, equipment, and material required to complete each task can be added to the chart. These details will be populated in task cards on the chart.
- Filters: The chart is equipped with filters to view tasks based on Assigner, Assigned to, Priority, Status, label, or any combination of these filters.
An interesting nugget about the illustrious history of Gantt charts in the world of project management: This powerful graphic tool for mapping tasks was developed by Karol Adamiecki, a Polish engineer, management researcher, economist, and professor, way back in 1896. This concept was then developed by Henry Gantt, adding interdependencies to it, developing it to look like the way we know it today. Famously, this method was used by him to show when the individual construction phases of the Hoover Dam were scheduled. Today, a cast bronze version of the original Gantt chart can still be seen at the Hoover Dam!
Now, let's list our tasks on the chart. Wondering how? Well, let's go one step at a time.
Adding tasks on the Gantt chart
Here are the steps to populate your Gantt chart with your project tasks:
- Hit the Plus icon in the Backlog column on the right
- Enter the title of your task and hit “Save”
- Open the task and set the task duration under “Assigned date” on the task card
You can now see your task as a bar on the chart across the timeline. Choose to view this timeline between Hour, Quarter day, Half day, Day, Week, and Month by clicking the Frame icon on the top-right of the chart. Add filters to your chart by hitting the filter button. Set the filter to Assigner, Assigned to, Priority, Status, label, or any combination of these. Also, you can filter your board based on the color-coding of tasks, priority, and status with the Drop icon on the Gantt chart. Isn't it amazing what you can do with the Gantt chart?
Now, all you need drag-and-drop task between columns to alter their stage of progress, and your entire team stays up-to-date with all the progress!
Equipped with everything you need to run a Gantt chart, let's learn about its utility to founders and project leaders!
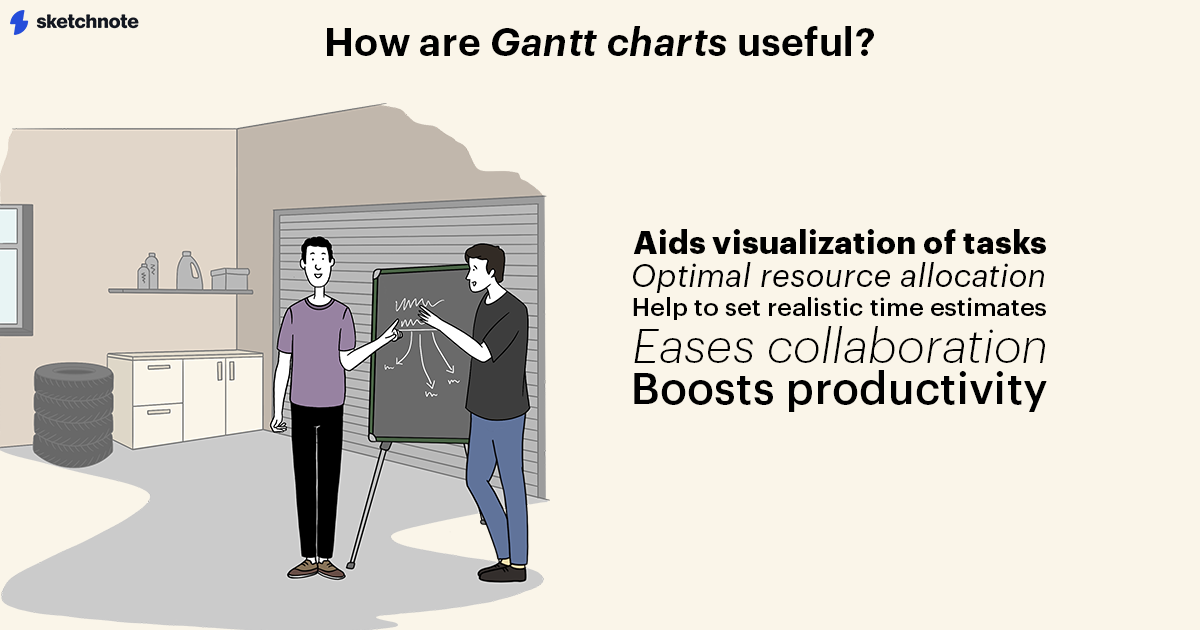
How do Gantt charts help founders and project managers?
Considering the project management challenges that founders and team leads face—with remote teams, conflicting time zones, miscommunication, and whatnot—the Gantt chart offers a solution for your entire team to stay on the same page. Here are a few ways this tool aids founders and project managers in their day-to-day:
Visualizing the entire project
Once you get a hang of using the Gantt chart correctly, it's extremely empowering to break down a huge project—like an Agile sprint, an accounts audit assignment, or building a content team in your startup—and visualize it across a timeline. The Gantt chart allows you to do exactly this!
Easily set time estimates for each task on a Gantt chart by moving or reducing the bar size of each “taskbar” across the horizontal time axis of the chart. With this tool, you can estimate when the entire project will get completed. Also, visualize dependencies between tasks on the chart, which aids in task prioritization. A simple glance at this chart provides a high-level overview of the project’s progress and its completion timeframe.
Overall, populating a Gantt chart after a strategy meeting can save you and your team from ambiguity on how to proceed with the meeting discussions.
Optimal resource allocation
By mapping your project tasks on a timeline, you're sure to have a clear idea of all the resources you need and when you need them, to accomplish your project goals. Project leaders can utilize this information to allocate tasks to the team and even outsource work if needed. Doing this legwork of planning ensures that the project stays on track and that any shortage in resources is accounted for.
At an individual level, this overall clarity ensures that teammates are not overburdened with tasks and unrealistic deadlines. This is because, with the Gantt chart, they know the timelines of all the projects they are a part of, and take on tasks based on available bandwidth only. It also allows teams to work around any potential scheduling issues before the project starts.
Realistic expectations of project completion
The Gantt chart exhaustively lists all the issues aligned with a project. All dependencies are mapped out and any leakages are exposed even before you begin. What’s more? A deadline for each aspect of the project is deliberated before even right at the outset of the project. By accounting for a reasonable buffer between tasks, the chart gives you a fair understanding of when to expect the entire project to be completed. It provides confidence to the people managing the project, as the project completion timeline is based on thorough planning. And this is done with inputs from each teammate, and not in an ambiguous manner.
Eases collaboration
The Gantt chart serves as a single source of truth that all teammates align with. All discussions about the project are framed around this presentation, and it aids in visualizing dependencies. Additionally, Gantt charts can be easily modified to account for changes in schedules, or delay in dependencies. On platforms like Sketchnote, the project Gantt chart can be easily shared with the team, so they can align with any changes made to the plan without any delay. It also does away with the common problem among teammates to work off conflicting understandings of what needs to be done.
Boosts productivity
There is a common misconception that being productive involves working long hours, over weekends, and grinding till you drop. But anyone with sufficient work experience knows that that's not always the case. In fact, that’s a surefire recipe to counter the burnout!
A more sophisticated approach to productivity includes having the right team, tools, and plan in place before getting started. The Gantt chart provides direct visibility of the team’s progress and encourages everyone to stay focused. It also ensures that teammates stay accountable for their tasks, and the overall project.
Mapping your project onto a Gantt chart lets you focus on your immediate tasks with the overall project goal in mind. Amazing, isn’t it? Now go ahead and create your own Gantt chart on Sketchnote! Good luck!
New to Sketchnote? Here’s why you need to build your startup with us
Sketchnote is an all-in-one startup OS for learning, team collaboration, doc management, and legal help. It’s a platform created for entrepreneurs, by entrepreneurs. With Sketchnote, you can bring your team on one page and work on top-of-the-line features such as:
- Workspaces that double up as a hub for your teams and projects
- Kanban and Whiteboards Boards that bring your tasks and teams together
- A fully-loaded markdown editor to create any document—from pitch decks to team wikis.
- Fill-and-go legal documents like NDAs, MOUs, ESOPs, and more
- Handcrafted and curated startup lessons to take a deep dive into every aspect of startup building and scaling.